
Get the complete picture of your cannabis dispensary’s performance with our comprehensive reporting dashboard. Consolidate your online sales, traffic, and growth metrics in one powerful platform designed specifically for dispensary owners who need data-driven insights without the technical complexity.
Everything you need to understand and optimize your dispensary’s digital performance
Account Snapshot
Account Snapshot puts your essential numbers front and center—no digging or toggling required. Instantly see total contacts, web form submissions, and phone calls from Google all at once. You can also layer in year-over-year and previous period data, or compare your current results to any custom date range you choose, right on the same page. With everything visualized side by side, it’s easy to spot patterns, pick up on changes, and measure real progress as it happens.

Contact Sources
Contact Sources breaks down exactly where your form submissions are coming from, whether it’s organic search, direct visits, referrals, or other channels. The dashboard makes it easy to see not just how many leads each traffic source delivers, but also how those numbers change over time. You can add previous period, year-over-year, or custom date comparisons to each channel, all in one view. This flexible setup helps you figure out which marketing efforts bring in real results, so you can focus on what’s working and adjust fast when things shift.
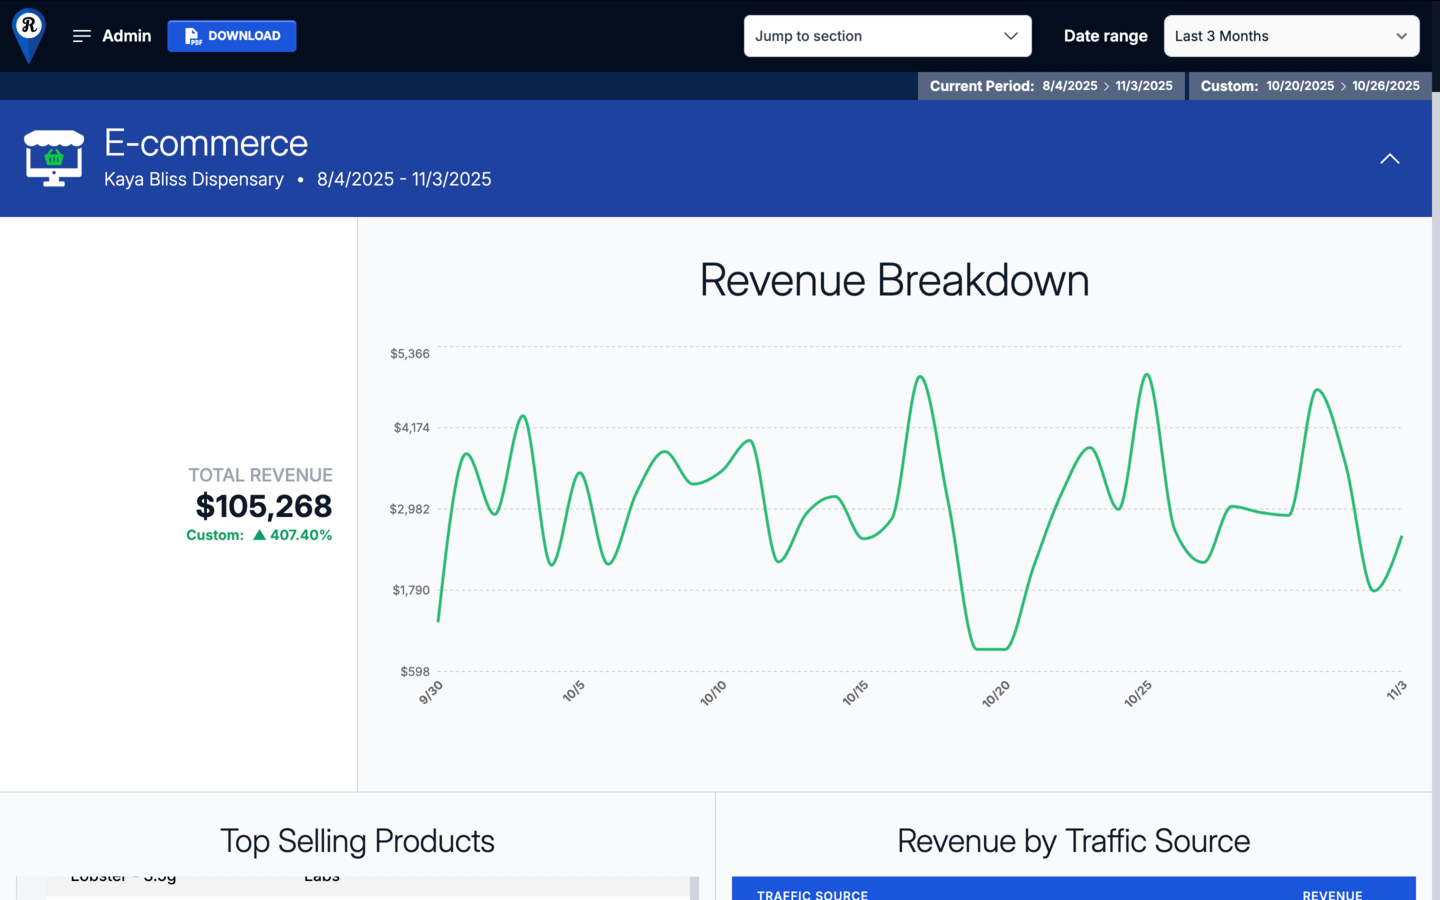
E-Commerce Reporting
View complete online sales performance across products, categories, and traffic sources. Track revenue trends over time, compare against previous periods, and apply custom date ranges to measure progress accurately.
- Revenue Breakdown shows total revenue movement across the selected timeframe, giving a clear view of sales activity and momentum.
- Top Selling Products identifies items driving the highest sales volume and revenue contribution.
- Revenue by Traffic Source attributes revenue to key acquisition channels, helping align marketing investment with performance.
- Revenue by Category measures contribution by product type to guide merchandising and promotional focus.
- Organic Revenue Over Time isolates organic sales trends to assess visibility and long-term channel growth.
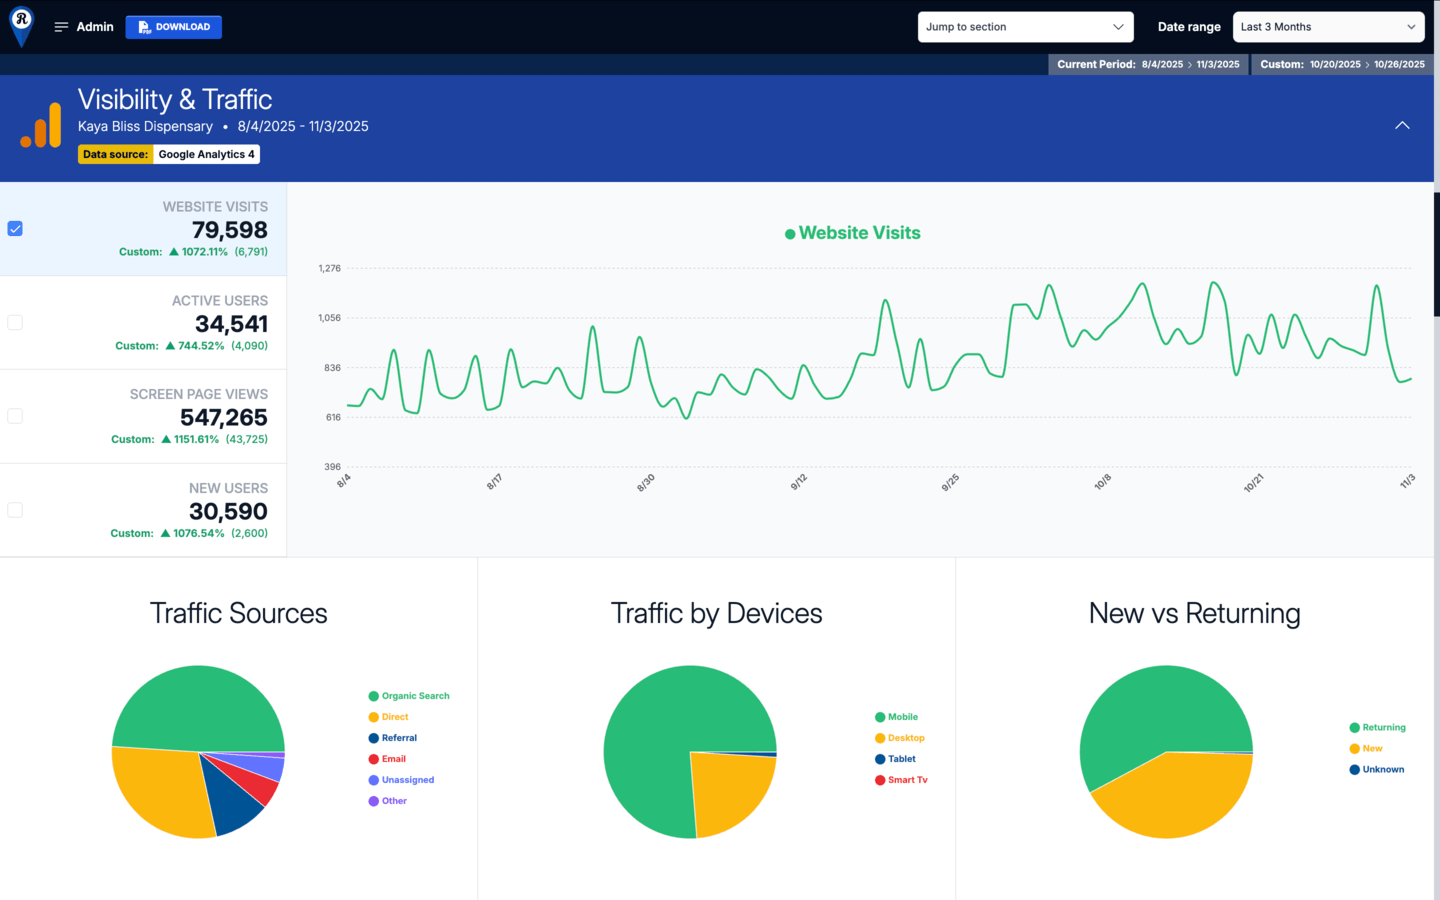
Visibility & Traffic
Measure how users find and engage with your website across all channels and devices. Compare total visits, active users, and engagement metrics against previous periods, year-over-year performance, or a custom timeframe to understand traffic growth and audience behavior.
- Website Visits tracks overall site activity and visibility trends over time.
- Traffic Sources identifies which channels—organic, direct, referral, or social—drive the most visits.
- Traffic by Devices shows how users access the site across mobile, desktop, and tablet for optimization insights.
- New vs Returning highlights customer loyalty and acquisition patterns by showing returning visitor ratios.
- Pageviews per Session, Sessions per User, and Average Session Duration evaluate user engagement depth and session quality.
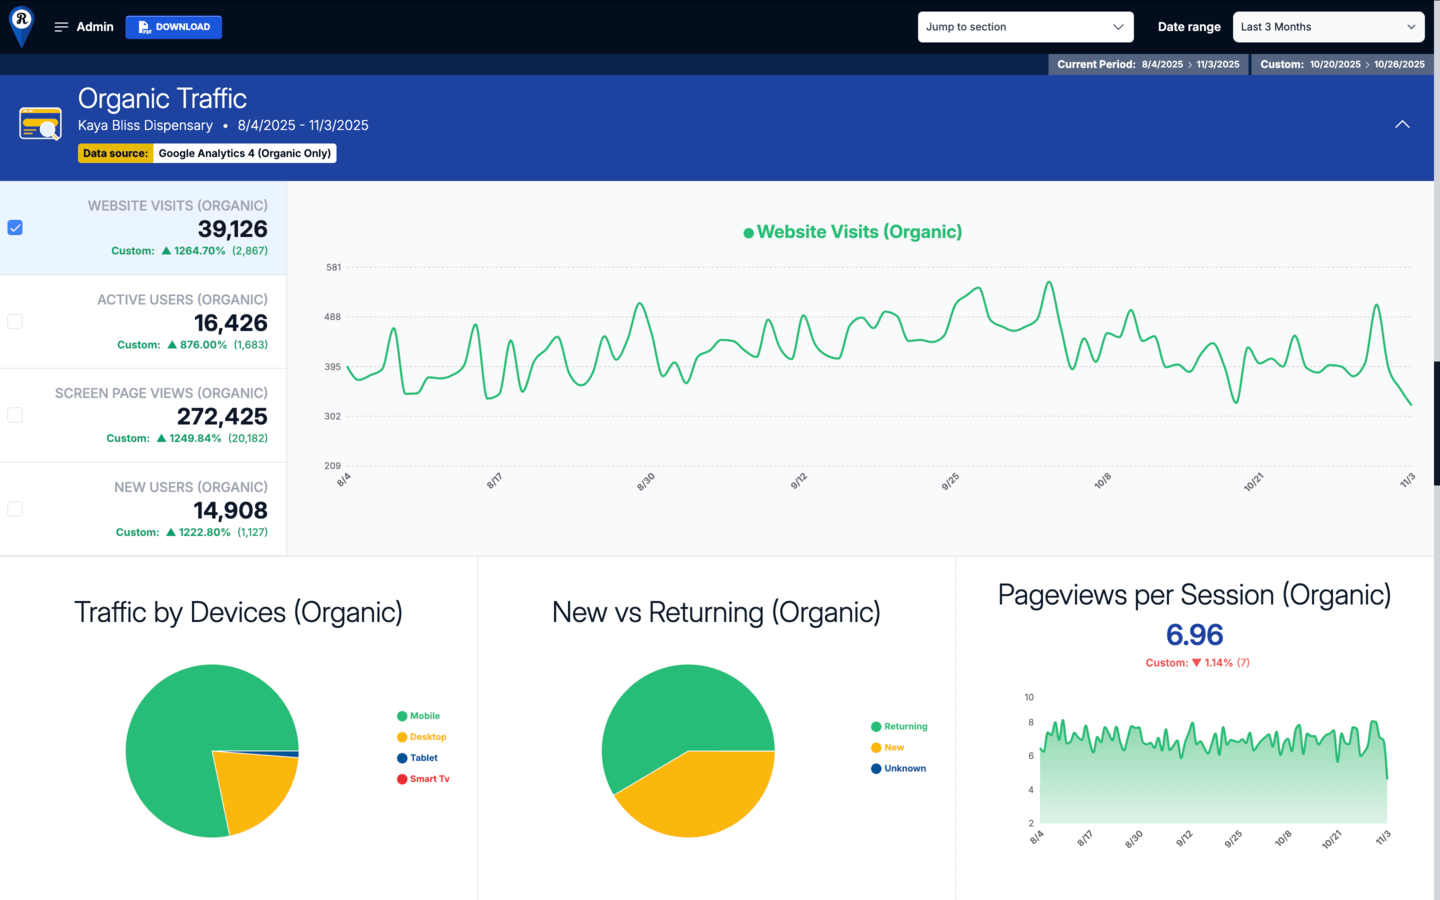
Organic Traffic
Evaluate website performance from unpaid search visibility and organic engagement. Compare current results to previous periods, year-over-year data, or a custom timeframe to assess the impact of SEO efforts and content performance over time.
- Website Visits (Organic) tracks all sessions generated through search engines to measure visibility and reach.
- Traffic by Devices (Organic) shows how organic users access the site across mobile, desktop, and tablet for user experience insights.
- New vs Returning (Organic) indicates how effectively organic search attracts new visitors while retaining existing ones.
- Pageviews per Session (Organic) reflects how deeply users engage with content once they arrive on site.
- Sessions per User (Organic) measures visit frequency to help identify audience loyalty and repeat engagement.
- Average Session Duration (Organic) highlights the quality of user engagement and how effectively pages hold attention.
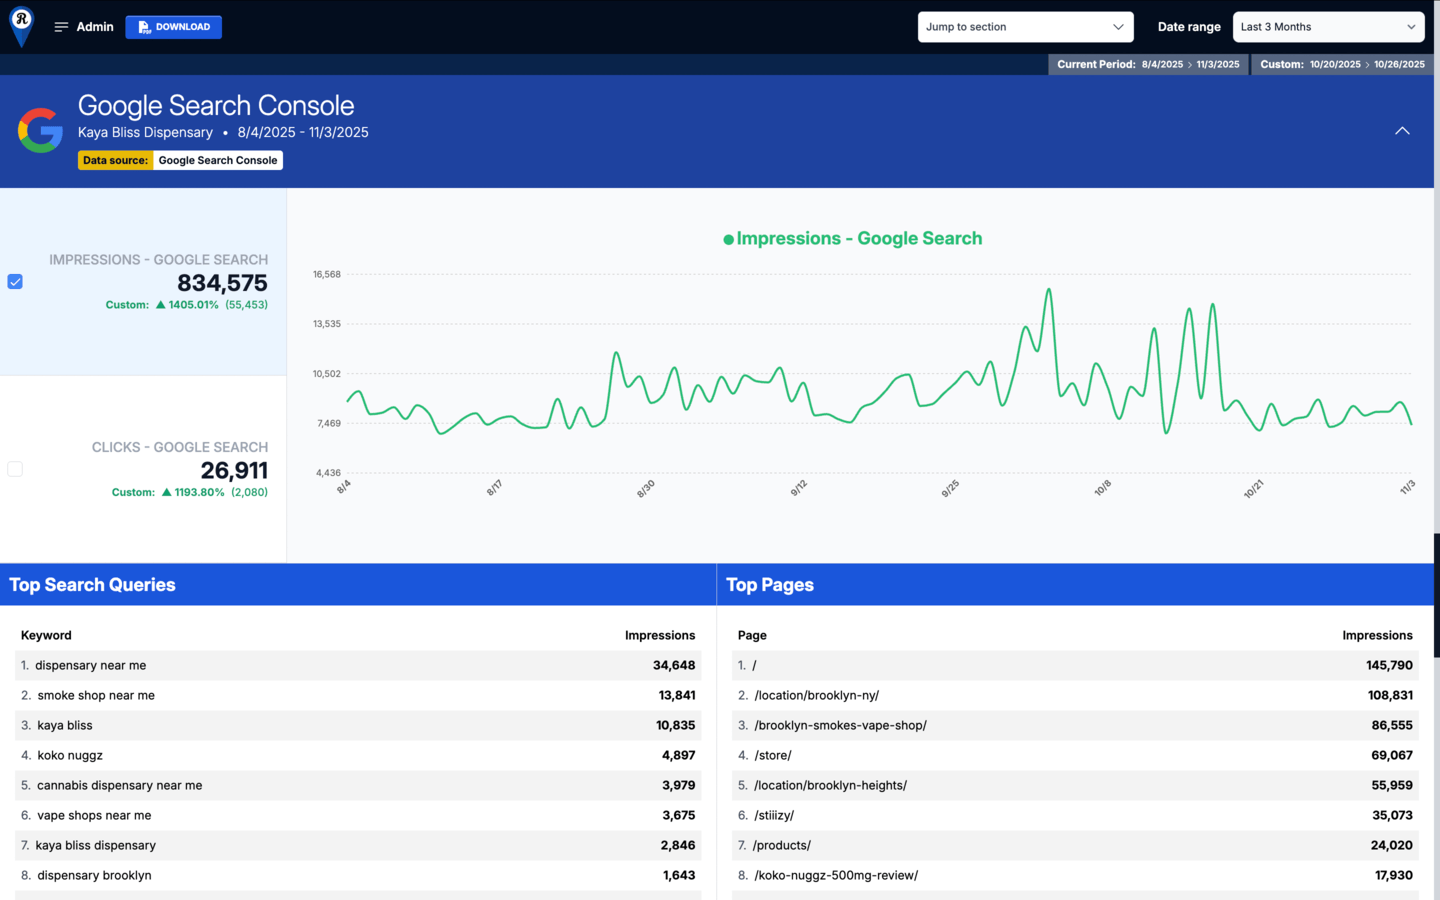
Google Search Console
Track how your site performs in Google Search. View impressions and clicks together or separately to evaluate visibility, engagement, and search intent at a glance. Compare data across previous periods, year-over-year results, or a custom timeframe to measure SEO growth and identify ranking momentum.
- Impressions – Google Search measures total visibility across search results, showing how often your pages appear for relevant queries.
- Clicks – Google Search highlights user interaction, revealing how effectively impressions translate into site visits.
- Top Search Queries lists the most common keywords driving traffic to your site, surfacing high-value opportunities for optimization.
- Top Pages identifies which pages generate the most search impressions, helping you focus on the content that attracts visibility.
- Highest Ranking Terms displays the strongest keyword associations with your domain, providing a snapshot of how Google interprets and indexes your brand presence.
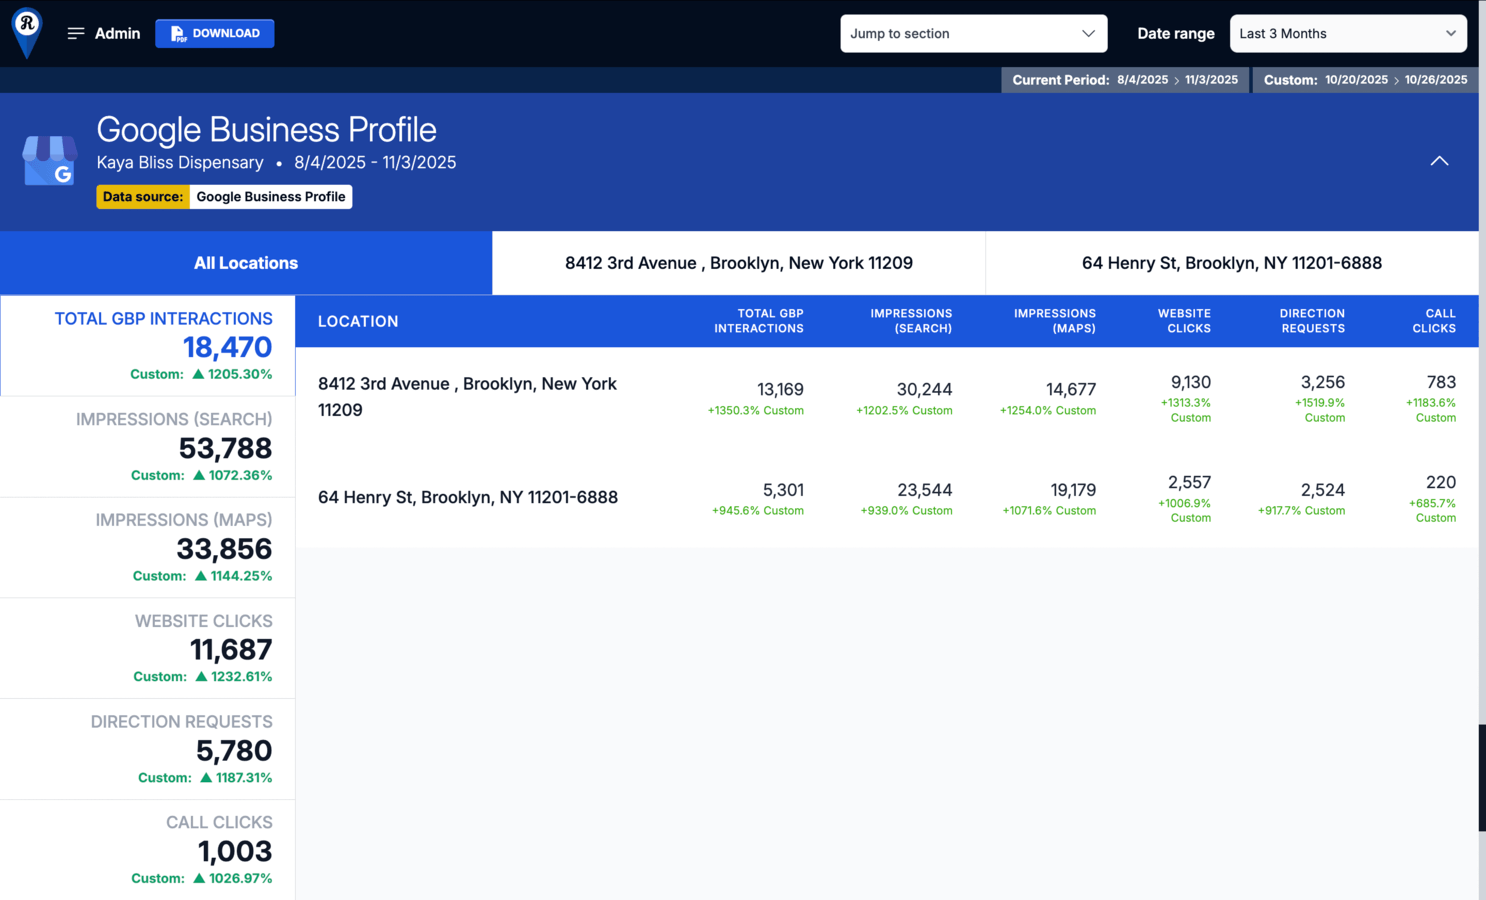
Google Business Profile
Monitor visibility and engagement across all verified business locations. Compare results across current, previous, and custom timeframes to evaluate how well your listings attract and convert local search traffic.
- Total GBP Interactions shows combined activity from searches, maps, calls, clicks, and direction requests across all locations.
- Impressions (Search) tracks how often your listings appear in Google Search results.
- Impressions (Maps) measures visibility within Google Maps for users searching nearby.
- Website Clicks shows how many users visit your site from your listings.
- Direction Requests reflects local demand and store visit intent.
- Call Clicks measures direct engagement through click-to-call actions.
- Location-level reporting provides a clear view of performance differences across each store, helping identify which markets drive the strongest engagement.
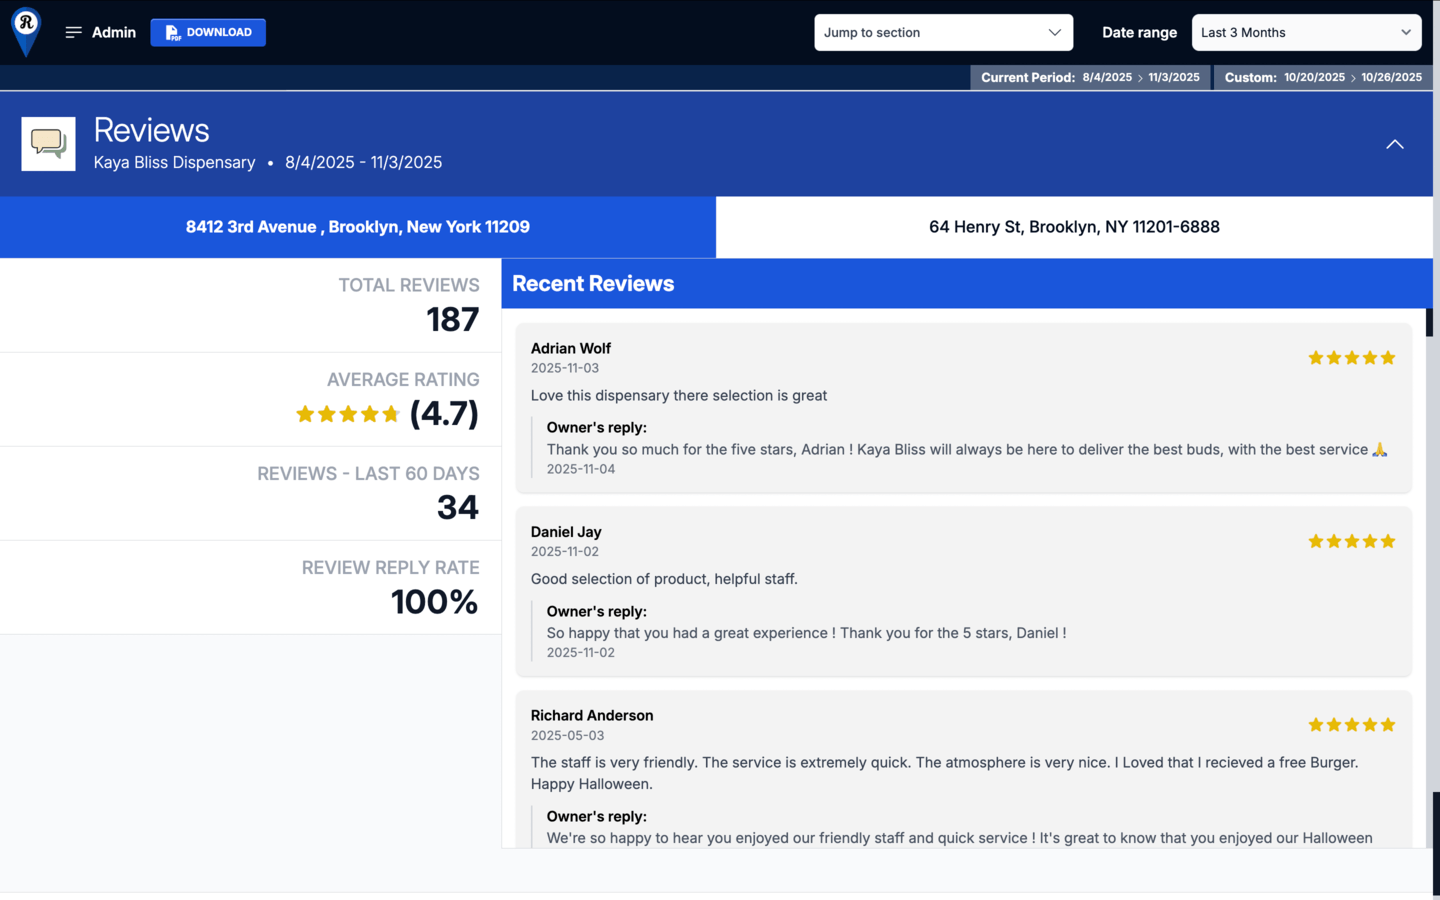
Reviews Management
Track customer feedback and reputation performance across every business location. Compare total reviews, average rating, and response activity over time to measure how effectively each team manages customer satisfaction.
- Total Reviews provides a running count of all published Google reviews for each location.
- Average Rating reflects overall customer sentiment based on recent review trends.
- Reviews – Last 60 Days shows current review activity to highlight momentum and engagement frequency.
- Review Reply Rate measures how consistently your team responds to customer feedback, a key factor in local SEO and trust signals.
- The Recent Reviews panel displays live customer comments and business replies for each location, making it easy to monitor quality and tone in public interactions.
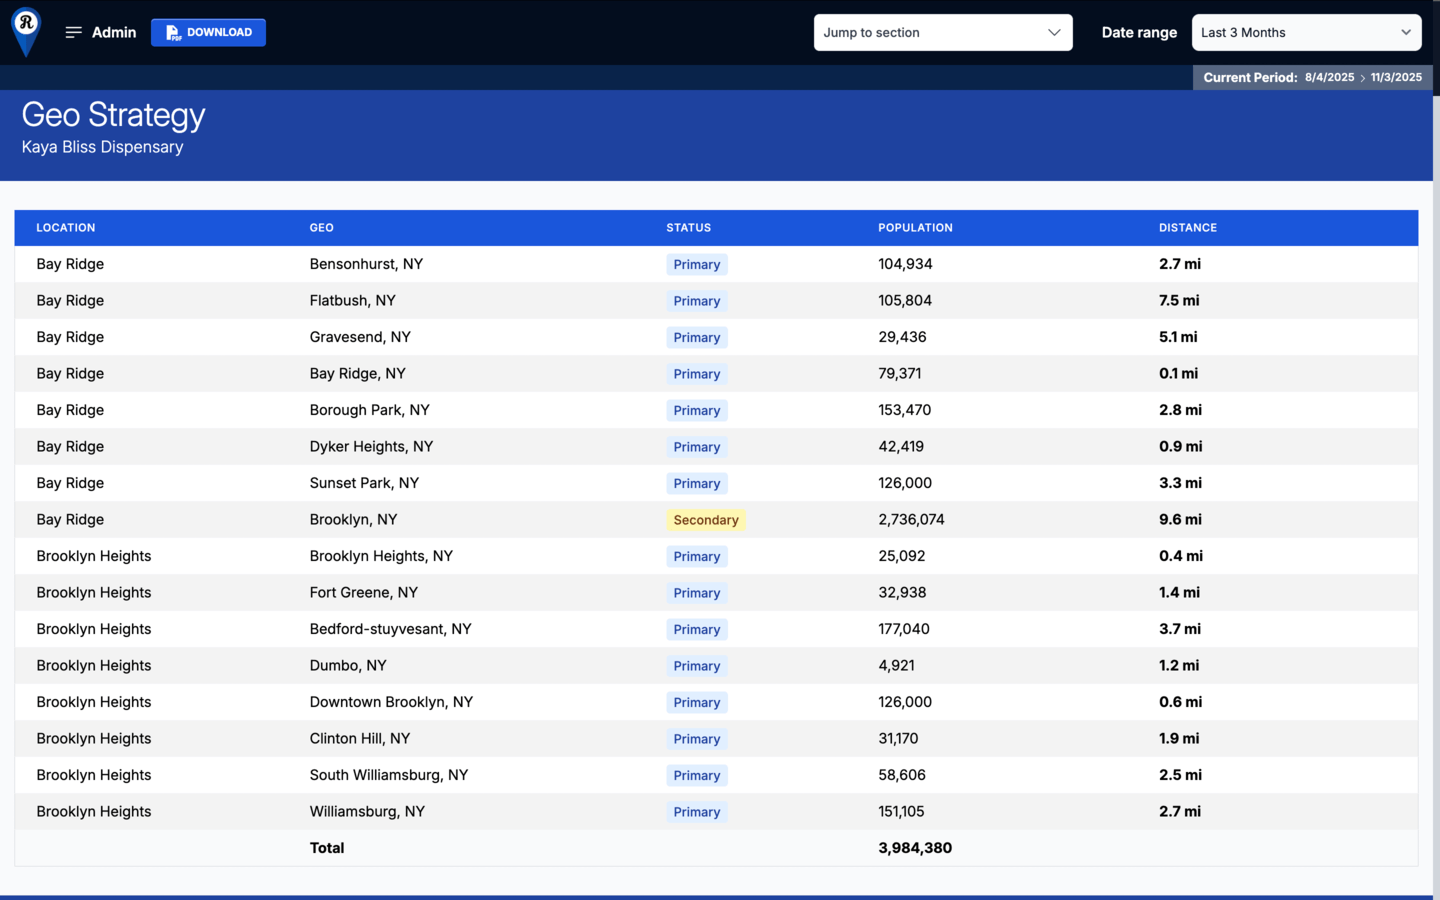
Geographic Data
Evaluate local market reach and proximity-based audience potential. This section maps nearby cities and neighborhoods surrounding each store location to highlight where primary and secondary customer bases reside.
- Geo lists all tracked cities within your target radius for visibility and competitive context.
- Status identifies each area as Primary or Secondary based on relevance and distance to the location.
- Population provides audience size estimates for local reach calculations.
- Distance measures proximity from the selected store to each city center, helping prioritize campaign focus and local targeting strategy.
- Use these insights to refine paid targeting, SEO focus areas, and delivery or service radius planning.
KPIs & More
View core performance metrics across defined timeframes to measure overall marketing effectiveness. Compare current data against previous periods or custom ranges to track movement across traffic, engagement, and conversion indicators.
- 4-Week Performance provides a near-term snapshot of recent activity to spot quick trends and campaign shifts.
- 13-Week Performance expands the view for longer-term comparison and sustained growth tracking.
- Metrics such as E-commerce Revenue, Organic Website Visits, Total GBP Interactions, Call Clicks, and Contact Form Submissions summarize the highest-impact outcomes across digital and local channels.
This section establishes a unified benchmark for performance measurement across all reporting modules.
Fully Customizable Reporting / Admin Controls
Customize your reporting view and data comparisons from a single control panel. Adjust global settings to show key metrics and historical performance across available modules.
- Enable or disable sections such as Key Performance Indicators and Geo Strategy to tailor the report to your goals.
- Activate Year-over-Year, Previous Period, or Custom Date Range comparisons to evaluate performance trends over time.
- Not all comparisons apply to every module, but when data exists, these settings automatically populate available metrics for consistent analysis.
- This panel gives users full flexibility to shape each report around relevant timeframes, data depth, and visibility preferences.
Navigation Controls
Move through your report quickly using the tools in the top-right corner of the dashboard.
The Jump to Section menu lets you go directly to any module, such as E-commerce, Visibility & Traffic, Organic Traffic, or Google Business Profile, without scrolling through the full report.
The Date Range selector adjusts the timeframe displayed across all sections, from daily performance to full-year views. Choose preset options or create a custom range to focus on specific campaign windows. These tools make it simple to navigate data, switch perspectives, and compare performance across time periods and modules.